
True real-time end-to-end observability requires high-quality data. That’s why Dynatrace launched OpenPipeline™ last year, our unified, high-performance stream processing engine designed to process massive and heterogeneous data sets in real time. We’re excited to share how recent enhancements to OpenPipeline elevate its scalability, manageability, and ease of use, making it simpler than ever to bring together observability, security, and business data for analytics in context. Whether you're ingesting telemetry from hundreds of services, dealing with massive log files, or processing many different data types and formats, OpenPipeline is your single solution for getting more value out of your data with less effort.
Empowering real-time insights through petabyte-scale data processing of all your data
Modern cloud native systems generate massive volumes of telemetry data, spanning logs, metrics, events, and traces. Extracting real-time, actionable insights and enabling meaningful alerting and root cause analysis requires more than just centralized data storage; it requires a scalable data pipeline. Without such a pipeline, even the most advanced analytics tools are constrained by data flow and preparation bottlenecks. To address these challenges, we launched OpenPipeline, our unified data ingest solution for the Dynatrace® platform. OpenPipeline is a customizable, scalable data pipeline for ingesting, transforming, and harmonizing data for reliable analysis and correlation.
With its latest enhancements, OpenPipeline supports real-time data processing even at petabyte scale, by reliably handling high volumes of logs, traces, and other telemetry. This level of scalable pipeline processing is essential for delivering timely insights, enabling Dynatrace to:
- Detect anomalies across distributed systems in real time
- Perform proactive security analytics and real-time vulnerability detection
- Offer real-time insights into your business processes
Scale is not only about the sheer amount of data signals. It’s also represented in the size of individual signals that can be handled. An increasing number of use cases, such as parsing JSON/XML request bodies, capturing detailed audit logs, exploring transactional data dumps, or analyzing input vectors from ML model logs, require the ability to efficiently process large log files. With the release of Dynatrace version 1.311, OpenPipeline now supports log records up to 10 MB in size, empowering you to use Dynatrace for high-volume use cases. For more information, have a look at this Dynatrace support for large log records blog post.
Break silos with unified ingestion across all data types
Alongside scale, OpenPipeline provides unified ingestion across all data types, removing silos, simplifying integration, and ensuring that all data, regardless of format or source, is enriched, contextualized, and processed in the same tool, ready for advanced analytics.
Recent enhancements to data type processing include:
- Spans: You can now configure how spans are processed, including dropping specific fields or entire records, and assign a security context for fine-grained, record-level access control. Spans can also extract metrics and route them into defined target buckets. Full ingest functionality for spans is coming soon.
- RUM data: Ingesting Real User Monitoring (RUM) data, including user events, sessions, and associated metrics, is currently in preview and will soon be made generally available for all Dynatrace SaaS customers.
- Events: OpenPipeline now supports custom processing rules for a broad range of event types, including security events, software development lifecycle (SDLC) events, business events, and Dynatrace internal system-level events.

Simplified pipeline management from setup to optimization
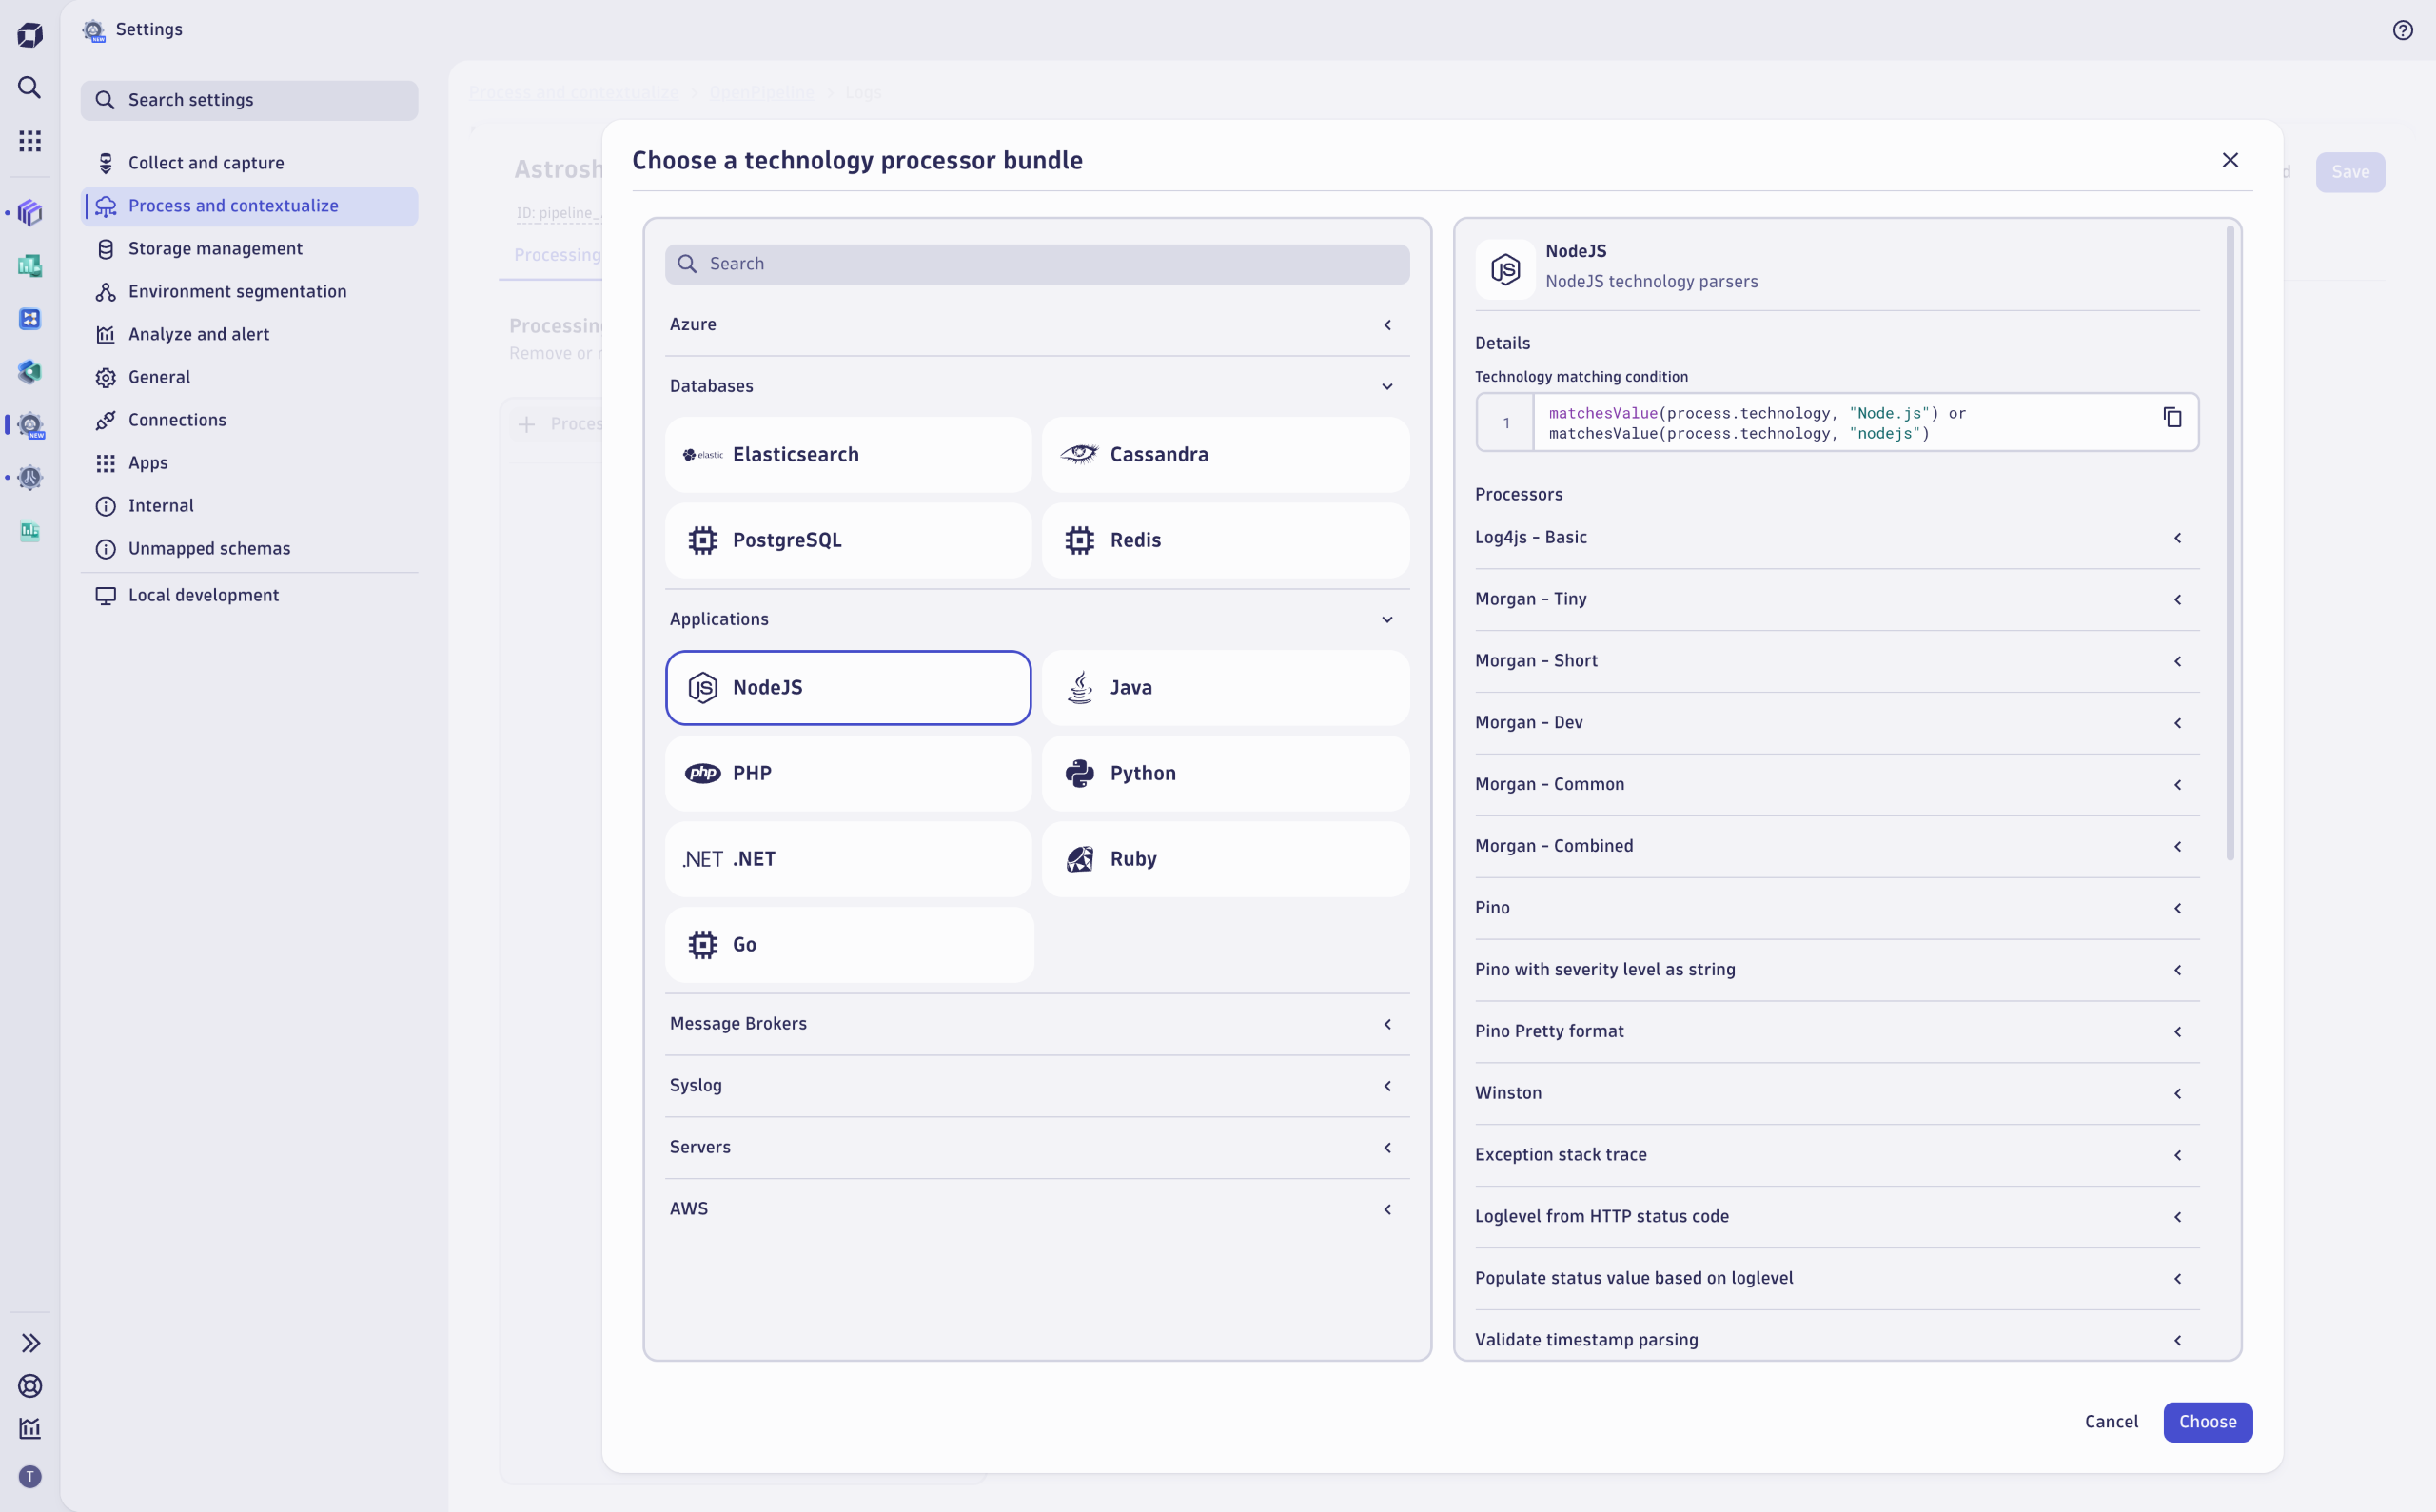
Historically, setting up pipelines for data ingestion involved time-consuming configuration of parsing, field mapping, and transformation logic for each data source. OpenPipeline now streamlines this process with ready-made processor bundles for widely used technologies and formats, accelerating data onboarding and standardizing data handling at scale for ingest sources such as:
- Hyperscaler support, including AWS and Azure
- Web servers like Apache, IIS, JBoss, HAProxy, or Nginx
- Programming languages like .NET, PHP, Java, Python, or NodeJS
- Databases and app frameworks like Elastic or Cassandra
With just a few clicks, you can apply a processor to a source, ensuring all fields are parsed correctly, attributes are renamed, and data structures are accurately standardized. Each bundle includes example records that can be tested interactively, with further customization available to meet specific requirements. This allows your teams to onboard new telemetry streams in minutes instead of hours. We’ll continue to expand our support to cover more technologies in the future. You can also create your own processors to handle any custom format.
Reveal hidden value with data transformation
Upon ingestion, modern observability, security, and business data can be structured in varying, often complex forms. OpenPipeline offers advanced transformation capabilities that allow for easy extraction of relevant data beyond the creation of simple events and metrics:
- Extract values from deeply nested JSON fields. For example, extract the threat identifier from a JSON-formatted security event and convert it into a security metric.
- Create unified metrics from different data types. For example, consolidate error codes from both logs and spans into a single metric for cross-service comparison.
Stay informed: Real-time visibility and alerting for your pipelines
To optimize pipelines, teams need visibility into their performance. OpenPipeline now exposes detailed metrics at key processing stages: ingest, routing, and output, as well as not-stored-records. With these metrics, you can instantly verify any pipeline configuration and detect anomalies early.
These metrics power:
- Real-time microcharts within the OpenPipeline user interface, showing data trends and ratios over the last 30 minutes.
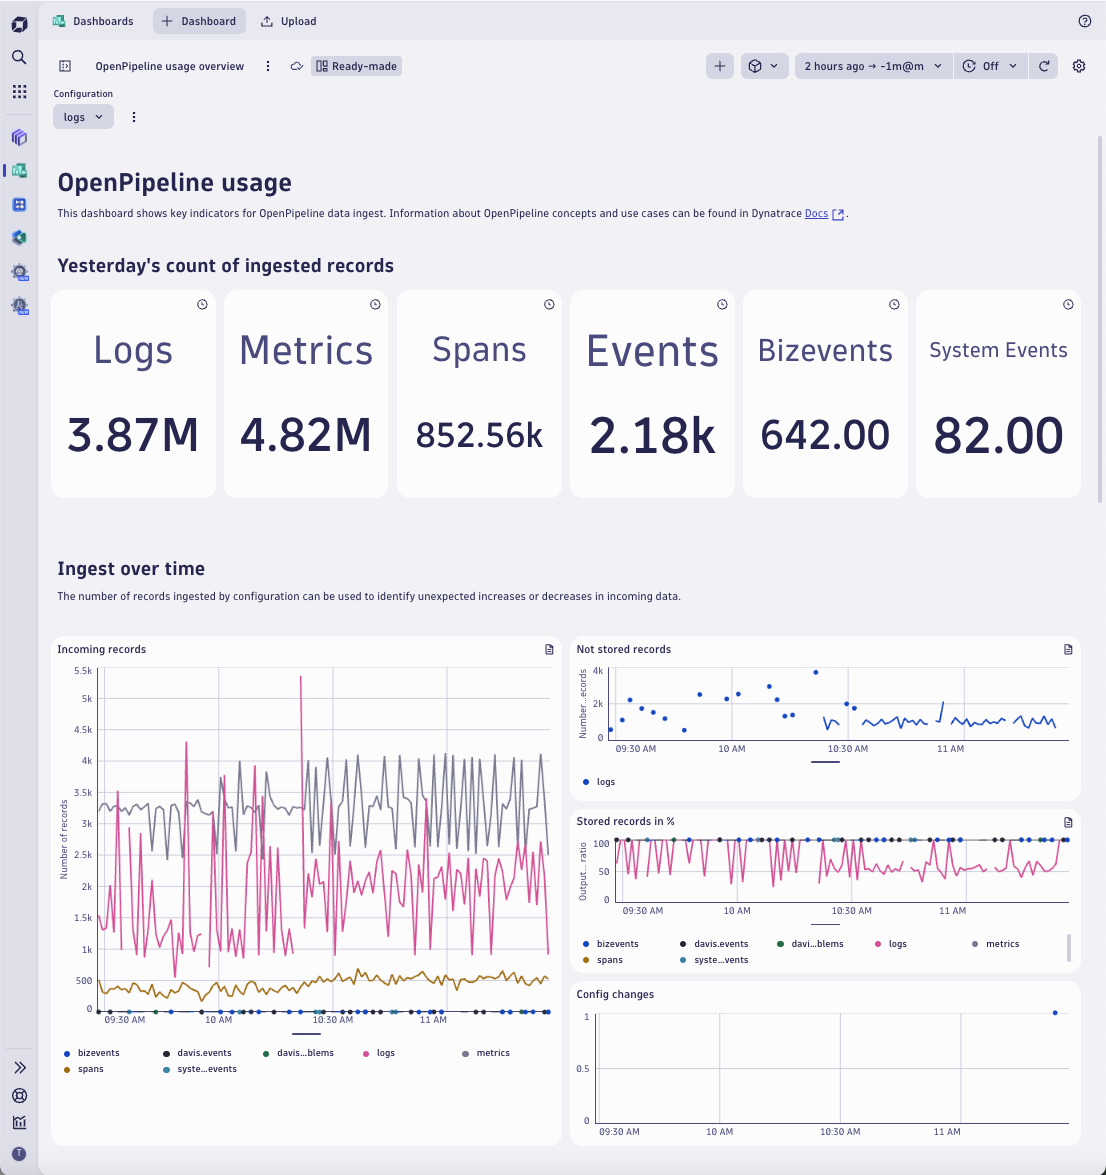
- A ready-made dashboard used to explore daily or weekly summaries, historic volume trends, and detailed routing stats by pipeline or source.
- Smart alerting. Traffic fluctuations on ingest are common, so you can leverage AI-powered dynamic baselining to raise custom alerts and detect anomalies before an issue occurs.
- Automated operations that trigger notifications or perform autonomous remediation steps once an ingest anomaly or traffic volume deviation is detected.
Easy transition to OpenPipeline for existing customers
For Dynatrace SaaS customers using classic pipelines, we’ve simplified the transition to OpenPipeline. Start utilizing OpenPipeline for new data sources while keeping your existing log processing configurations fully operational and uninterrupted. This side-by-side, risk-free approach supports gradual adoption and allows you to modernize your data processing without disrupting ongoing workflows.
Get started today
OpenPipeline is now available to all customers running the latest version of Dynatrace SaaS. Already today, you can:
- Benefit from processing a broad range of data types, including logs, traces, events, and RUM data (currently in preview).
- Take advantage of processing the full payload of large log records, parse embedded XML or JSON structures, parse events or metrics from complex log records, or use them for deep search analytics and forensic use cases—all without splitting individual log lines into separate events. Leverage the built-in processor bundles to get started with popular formats.
- Explore the ready-made OpenPipeline dashboard on the Dynatrace Playground.
- Use real-time pipeline metrics to tune and optimize your configurations.


Looking for answers?
Start a new discussion or ask for help in our Q&A forum.
Go to forum